

The
MacroEconomic Calendar
The MacroEconomic Calendar
Mar 24, 2025
Week of March 24, 2025
Week of March 24, 2025

AJ Giannone, CFA

The Setup & Where to Focus
The S&P 500 was little changed last week, climbing just 0.5% during Fed Week and as traders await the April 2 “Liberation Day” in which President Trump intends to assign reciprocal tariff rates to all countries tariffing US goods.
Thursday and Friday were particularly quiet after the FOMC left its policy rate unchanged Wednesday afternoon. A lack of tariff chatter out of the White House last week was likely welcomed relief after what has been a headline-driven market in the past two months.
Despite US stocks hovering not far from their year-to-date lows, the Volatility Index (VIX) settled under 20 for the first time in three weeks—a sign of improved confidence on macro conditions.
The data deck is light to wrap up the first quarter, but personal income and spending numbers, along with PCE for February, will keep traders’ attention on Friday.
Markets took last week’s Retail Sales report and Fed decision in stride.
Equities advanced 0.6% Monday, fell 1.1% Tuesday, then rallied after Chair Powell spoke last Wednesday afternoon, closing up by more than 1% for a rare jump after Jay’s Q&A. Thursday and Friday were close to unchanged. Under the surface, it was also uneventful.
There was some jostling among the Mag 7 stocks, but all told, they moved little over the five days. NVIDIA (NVDA) was the notable laggard, dropping 3.3% during its big GTC and AI Developers’ conference. Despite upbeat words and grandiose plans laid out by CEO Jensen Huang, NVDA remains down 12% in 2025 and 23% off its all-time high notched in January. A bearish “death cross” printed on the chart, a situation in which the 50-day moving average moves below the 200-day moving average.
Energy (XLE) was the top-performing sector, even with WTI crude oil remaining below $70. Shares of oil & gas companies collectively rallied 3.2%, outpacing the Financials (XLF) sector for the top spot.
Materials (XLB) and Consumer Staples (XLP) lost the most last week, but declines were very modest. Small caps (IWM) added 0.4%, and international stocks (VEU) were down fractionally.
US equities outperformed ex-US by almost two percentage points from Wednesday through Friday—the best 3-day relative rally since November as fervor for foreign stocks finally cooled.
Likewise, the US Dollar Index (DXY) found its footing at the 103 mark after a nasty early-year drubbing that saw the greenback give back seven handles from its 110 multi-year peak in mid-January. Major FX pairs may hold current levels until Liberation Day.
Indeed, the zeitgeist for now is “wait and see.” Macro investors stand by for what comes about on April 2. At the same time, C-suites across the country appear to be holding off on capital investment plans until further details on trade policy are released. Also in a holding pattern is the Fed.
Last Wednesday, the FOMC left interest rates unchanged, as expected, but there were important nuances within the statement and Powell’s press conference.
The quarterly Summary of Economic Projections (SEP), known as the dot plot, revealed weaker growth expectations and forecasts for higher inflation this year and next. While some in the media dubbed it “stagflationary,” conditions will not come anything close to what was seen in the 1970s when inflation ran above 5% for years on end with unemployment averaging near 8%. The media continues to portray an imminent economic calamity, but neither the Fed’s nor market-based indicators suggest that’s likely.
Tweaks were made to quantitative tightening plans—the Fed announced a slowdown in its balance sheet runoff, effectively reducing the cap on US Treasury redemptions. That was generally interpreted as a stimulative adjustment, but Powell enforced the notion that it was housekeeping more than anything. Helping to drive upside in the S&P 500 Wednesday afternoon was Powell’s apparent willingness to adapt to how macro conditions might evolve depending on trade policy.
Investors have been banking on a “Fed put,” the idea that if high tariff rates are enforced for an extended period, the FOMC would be more accommodative to support demand. The Fed chief brought out the “T” word—transitory—when describing tariffs’ net effect on markets.
As most academic research shows, higher import duties are often a one-time upward price adjustment (as much as the media drives the false narrative that President Trump charging others what they charge us would result in an upward price spiral). Furthermore, the percentage of overall tariffs paid by consumers is still unclear—companies importing goods and the exporting countries will bear some of the cost. Households can also substitute for cheaper, non-tariffed goods. All these possibilities may have gone into the Fed’s calculus.
By the time the dust settled Wednesday, risk assets were higher, and expectations for a rate cut in May fell. As it stands, 67 basis points—between two and three eases—is priced into this year. It wasn’t all about the Fed last week.
Monday’s February Retail Sales report came in softer than expected, but it was an improvement from January’s dreadful consumer spending update.
At +0.2%, it was below the +0.6% consensus forecast, and while that headline number was weak, the core control group beat Wall Street estimates, which is key because that barometer feeds into GDP.
The media used the report to drive its negative opinion on Trump’s policies, but the report’s internals suggested that weather may have played an outsized role in February consumption—restaurant and gas station spending was light, but nonstore retailer (e-commerce) sales jumped by 2.4%.
In aggregate, downwardly revised January Retail Sales data and last month’s unimpressive overall numbers should weigh on Q1 GDP; it's another sign that the economy was already decelerating before Trump took office.
In general, America-First policies will likely take a minimum of six to 12 months to filter through to real data, perhaps nine to 18, depending on how macro conditions unfold. Allio’s team continues to debate and pin down precise timing.
Coming into the quarter’s final week, we expect volatility to be somewhat subdued, particularly if President Trump offers few new clues on tariffs.
The data slate is light aside from Friday’s inflation figures, and there are few earnings releases. Further out, the Q1 earnings season, which begins with JPMorgan (JPM) on the morning of April 11, could be the clearing event markets need to rally.
By then, we’ll have February PCE and the March jobs report in hand, not to mention refined details on trade policy. Markets typically respond negatively to uncertainty; historically, clearer economic data and corporate guidance have often been associated with improved market sentiment.
GDP growth could potentially remain subdued until there's clearer evidence regarding how current policies might impact the macroeconomy. Investors must remember that stocks generally move about six months ahead of economic changes.
Weekly Calendar Look Ahead
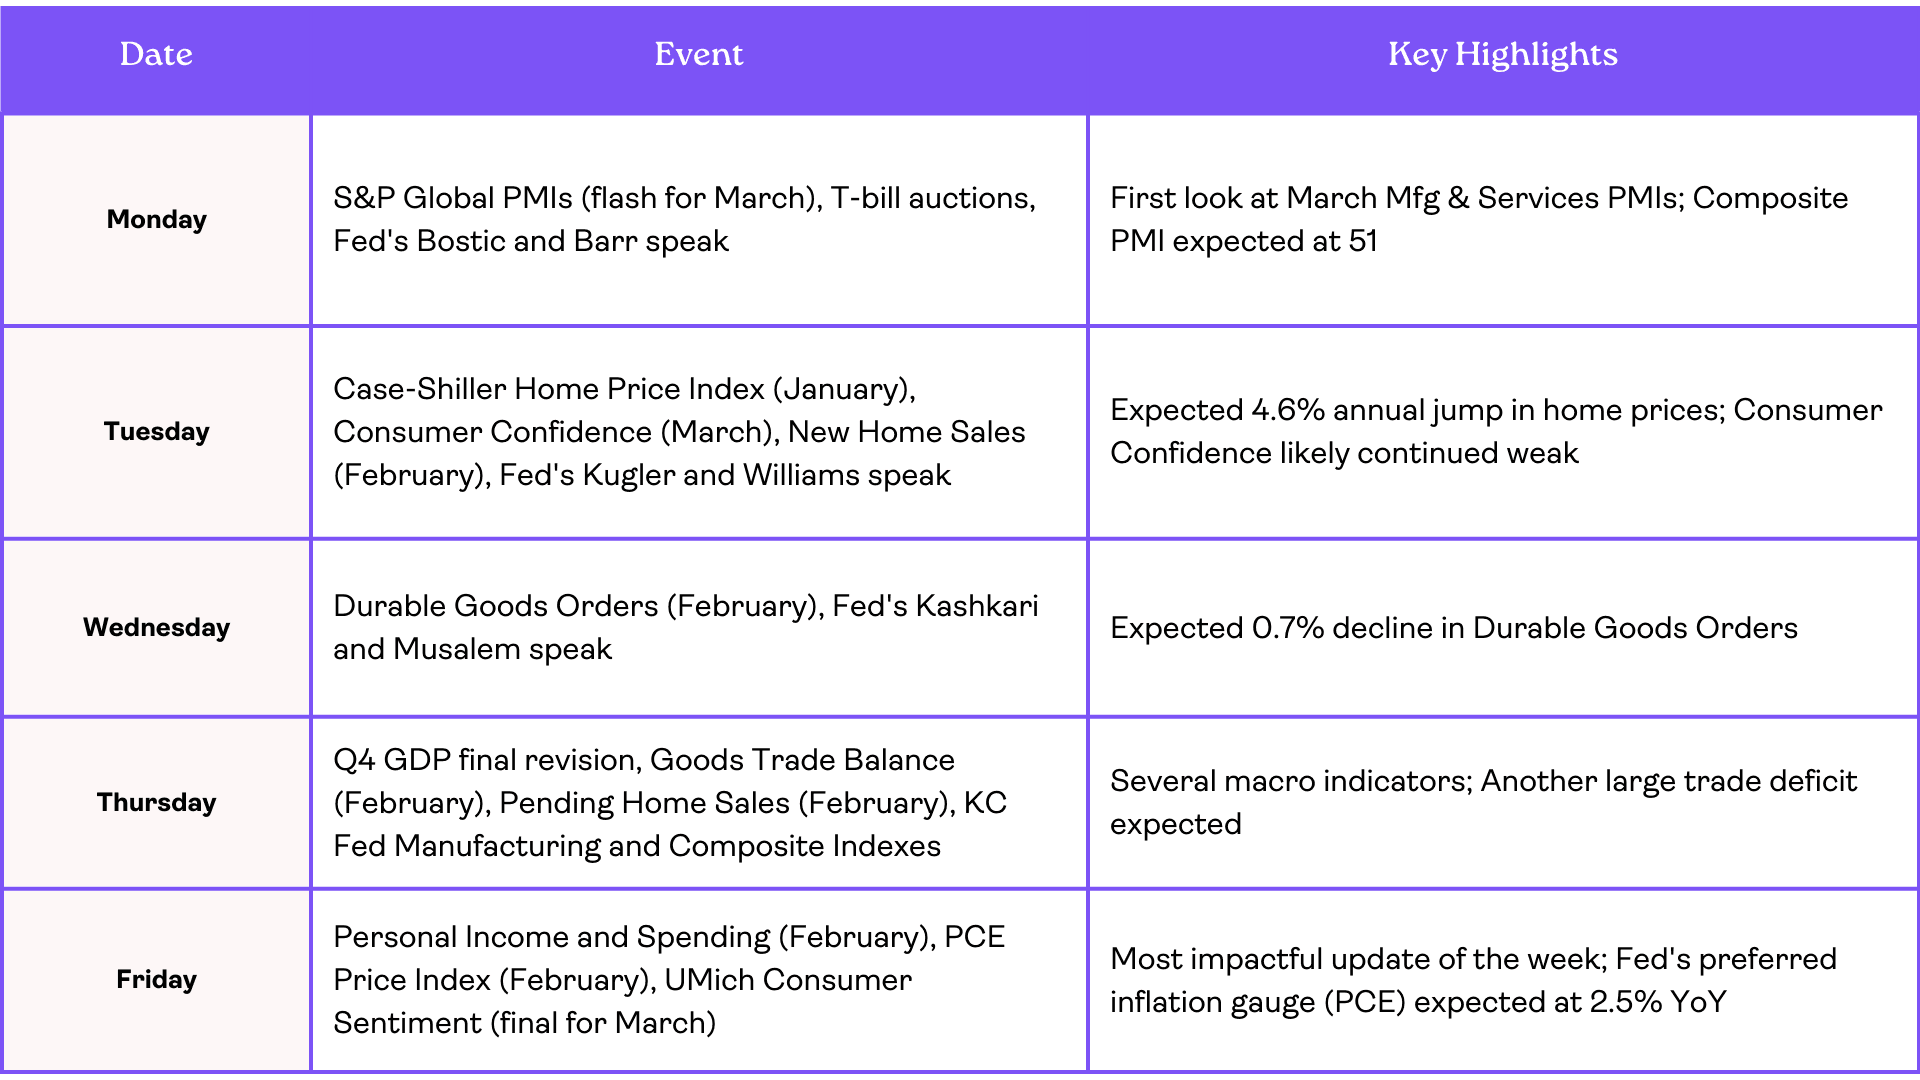
While there aren’t many impactful reports this week, Monday morning’s S&P Global PMIs (flash for March) could move the stock and bond markets. We’ll get both the Manufacturing and Services gauges right after the opening bell. Economists expect numbers above 50—indicating expansion—which would bring the Composite PMI to 51, almost unchanged from February. This is an important “vibes” report as it surveys over 800 companies around the country. Not as widely telegraphed as the ISM’s PMIs, S&P Global’s version still often contains nuggets on the macro, particularly on sales, new orders, employment, inventories, and prices. February's Composite score was the weakest since April 2024, with the service sector having slowed to a 15-month low—once again, it’s the “wait and see” economy. T-bill auctions hit later in the morning, and the Fed’s Bostic and Barr speak in the afternoon.
More Fed speak comes Tuesday via Kugler and Williams in the morning. Johnson Redbook retail sales arrives in the premarket before a January read on US home prices from the S&P/Case-Shiller Home Price Index; forecasters expect a 4.6% annual jump in real estate values. Later, The Conference Board’s March Consumer Confidence report crosses the wires at 10 a.m. ET—this survey is more closely linked to labor market conditions than the University of Michigan’s report. The Richmond Fed Index—a regional business activity survey—is released at the same time as February New Home Sales.
The mid-week headliner is Durable Goods for February. A sequential decline of 0.7% is expected. Kashkari and Musalem—a pair of hawks—speak Wednesday morning.
Thursday’s slate is packed with macro updates, but they shouldn’t be too impactful. A final revision to Q4 GDP and its related components (PCE prices, sales, consumer spending, corporate profits) comes in the premarket along with the usual jobless claims data. Last week, Initial Claims was once again low, with no meaningful change in the trend of Continuing Claims. Also at 8:30 a.m. ET, the Goods Trade Balance figures for last month are released—the deficit widened to a record $153.3 billion in January, and economists expect a tighter (but still massive) $134.6 billion negative goods imbalance as firms stock up before tariffs. Heavy imports from January through March will surely weigh on Q1 GDP. Later, Pending Home Sales for February are released—with mortgage rates now firmly below 7%, we could see a pickup as the spring selling season gets closer. The KC Fed Manufacturing and Composite Indexes prints at 11 a.m. before Treasury auctions and a speech by Barkin at the Fed.
With several “B and “C” level economic reports Monday through Thursday, the focus shifts to the most impactful update—Friday’s Personal Income and Spending update and PCE Price Index refreshes for February. The consensus calls for a 0.6% sequential spending increase, with incomes rising by 0.4%, bringing the Personal Saving Rate down slightly from January’s seven-month high. The headline PCE Price Index is seen as having risen by 0.3% month-over-month, with the core rate climbing by the same. That would bring the Fed’s preferred inflation gauge to 2.5% YoY (2.6% core). The week’s chorus of Fed speak continues into the afternoon, but not before a final look at the politically-charged UMich consumer sentiment survey—a gauge that Powell dubbed “an outlier” during last week’s presser and a report Allio has widely dismissed as a relevant macro indicator in recent months.
Fiscal Policy Framework
Congress returns for a three-week session before its spring recess, and GOP lawmakers will focus on their budget reconciliation package. House Republicans target an April 7 resolution to keep the government funded through September. The draft may include details on the debt limit as well. Senate Democratic Leader Chuck Schumer came under fire from his colleagues and others on the left for caving to the GOP earlier this month as the March government shutdown loomed. Depending on how legislation progresses, we could see more Democratic infighting as the party struggles to find a new identity. Recent polls show the Democratic Party’s favorability at record lows.
Senate Republicans will meet to flesh out long-term budget forecasts, including penciling in fiscal impacts to extending the 2017 Tax Cuts and Jobs Act, which may cost between $4-$5 trillion. In the here and now, the April 2 tariff date is front and center. President Trump said on Friday that there may be flexibility with certain countries, and stocks inched into the green on that news. Among G20 countries, the US actually has the least amount of total trade barriers, per BofA Global Research, so there is increasing chatter that Trump’s tariffs will ultimately work to boost free trade—that would be a tremendously bullish development if it were to occur.
Risks and Opportunities
Last week, we noted that the case for an oversold bounce had increased, and after Tuesday’s decline, markets finally rebounded. The S&P 500 has now rallied intraday in five of the past six sessions, suggesting that the bulls are trying their best to grab a foothold of the near-term trend. Unfortunately, consumer stocks and small caps keep lagging—we had hoped for a more impressive bounce, particularly after a dovish Fed Day last week. The dollar experienced a rally last week, aligning with scenarios we previously discussed as possibilities—the DXY turned oversold before rising by 0.8% over the back half of the week.
Given the upcoming macroeconomic data and hedge fund positioning ahead of quarter-end, volatility may potentially increase this Thursday and Friday. Barring tariff developments, investors will be on edge ahead of April 2. It’s important to call out that the VIX closed below 20 last week—it's a reminder that markets can only be shocked so many times by the same sort of headlines.
Our team is concerned, though, about price action in large tech stocks. Collectively, there has not been a strong bounce off their March lows. Typically, we’d like to see a washout, or capitulation-like, move before turning bullish on a particular space. We’ll see if we get that among the Mag 7 before the aforementioned potential market-clearing events.
Quick Hits
Copper prices rose to an all-time high last week, which may suggest positive economic signals
BofA’s March Global Fund Manager Survey showed the biggest drop in US equity allocations on record (though EPFR data revealed inflow to domestic stocks last week)
CoreWeave (CRWV) is expected to IPO Wednesday night and begin trading Thursday, the highest-profile IPO of the year
Gold touched another all-time high ($3057) last week. It’s up 11 of the past 12 weeks.
9 of 11 S&P 500 sector are up on the year, suggesting decent market breadth
As Chair Powell noted, long-term inflation expectations are subdued at 2.15%, per the 5-10-year breakeven inflation rate
The Setup & Where to Focus
The S&P 500 was little changed last week, climbing just 0.5% during Fed Week and as traders await the April 2 “Liberation Day” in which President Trump intends to assign reciprocal tariff rates to all countries tariffing US goods.
Thursday and Friday were particularly quiet after the FOMC left its policy rate unchanged Wednesday afternoon. A lack of tariff chatter out of the White House last week was likely welcomed relief after what has been a headline-driven market in the past two months.
Despite US stocks hovering not far from their year-to-date lows, the Volatility Index (VIX) settled under 20 for the first time in three weeks—a sign of improved confidence on macro conditions.
The data deck is light to wrap up the first quarter, but personal income and spending numbers, along with PCE for February, will keep traders’ attention on Friday.
Markets took last week’s Retail Sales report and Fed decision in stride.
Equities advanced 0.6% Monday, fell 1.1% Tuesday, then rallied after Chair Powell spoke last Wednesday afternoon, closing up by more than 1% for a rare jump after Jay’s Q&A. Thursday and Friday were close to unchanged. Under the surface, it was also uneventful.
There was some jostling among the Mag 7 stocks, but all told, they moved little over the five days. NVIDIA (NVDA) was the notable laggard, dropping 3.3% during its big GTC and AI Developers’ conference. Despite upbeat words and grandiose plans laid out by CEO Jensen Huang, NVDA remains down 12% in 2025 and 23% off its all-time high notched in January. A bearish “death cross” printed on the chart, a situation in which the 50-day moving average moves below the 200-day moving average.
Energy (XLE) was the top-performing sector, even with WTI crude oil remaining below $70. Shares of oil & gas companies collectively rallied 3.2%, outpacing the Financials (XLF) sector for the top spot.
Materials (XLB) and Consumer Staples (XLP) lost the most last week, but declines were very modest. Small caps (IWM) added 0.4%, and international stocks (VEU) were down fractionally.
US equities outperformed ex-US by almost two percentage points from Wednesday through Friday—the best 3-day relative rally since November as fervor for foreign stocks finally cooled.
Likewise, the US Dollar Index (DXY) found its footing at the 103 mark after a nasty early-year drubbing that saw the greenback give back seven handles from its 110 multi-year peak in mid-January. Major FX pairs may hold current levels until Liberation Day.
Indeed, the zeitgeist for now is “wait and see.” Macro investors stand by for what comes about on April 2. At the same time, C-suites across the country appear to be holding off on capital investment plans until further details on trade policy are released. Also in a holding pattern is the Fed.
Last Wednesday, the FOMC left interest rates unchanged, as expected, but there were important nuances within the statement and Powell’s press conference.
The quarterly Summary of Economic Projections (SEP), known as the dot plot, revealed weaker growth expectations and forecasts for higher inflation this year and next. While some in the media dubbed it “stagflationary,” conditions will not come anything close to what was seen in the 1970s when inflation ran above 5% for years on end with unemployment averaging near 8%. The media continues to portray an imminent economic calamity, but neither the Fed’s nor market-based indicators suggest that’s likely.
Tweaks were made to quantitative tightening plans—the Fed announced a slowdown in its balance sheet runoff, effectively reducing the cap on US Treasury redemptions. That was generally interpreted as a stimulative adjustment, but Powell enforced the notion that it was housekeeping more than anything. Helping to drive upside in the S&P 500 Wednesday afternoon was Powell’s apparent willingness to adapt to how macro conditions might evolve depending on trade policy.
Investors have been banking on a “Fed put,” the idea that if high tariff rates are enforced for an extended period, the FOMC would be more accommodative to support demand. The Fed chief brought out the “T” word—transitory—when describing tariffs’ net effect on markets.
As most academic research shows, higher import duties are often a one-time upward price adjustment (as much as the media drives the false narrative that President Trump charging others what they charge us would result in an upward price spiral). Furthermore, the percentage of overall tariffs paid by consumers is still unclear—companies importing goods and the exporting countries will bear some of the cost. Households can also substitute for cheaper, non-tariffed goods. All these possibilities may have gone into the Fed’s calculus.
By the time the dust settled Wednesday, risk assets were higher, and expectations for a rate cut in May fell. As it stands, 67 basis points—between two and three eases—is priced into this year. It wasn’t all about the Fed last week.
Monday’s February Retail Sales report came in softer than expected, but it was an improvement from January’s dreadful consumer spending update.
At +0.2%, it was below the +0.6% consensus forecast, and while that headline number was weak, the core control group beat Wall Street estimates, which is key because that barometer feeds into GDP.
The media used the report to drive its negative opinion on Trump’s policies, but the report’s internals suggested that weather may have played an outsized role in February consumption—restaurant and gas station spending was light, but nonstore retailer (e-commerce) sales jumped by 2.4%.
In aggregate, downwardly revised January Retail Sales data and last month’s unimpressive overall numbers should weigh on Q1 GDP; it's another sign that the economy was already decelerating before Trump took office.
In general, America-First policies will likely take a minimum of six to 12 months to filter through to real data, perhaps nine to 18, depending on how macro conditions unfold. Allio’s team continues to debate and pin down precise timing.
Coming into the quarter’s final week, we expect volatility to be somewhat subdued, particularly if President Trump offers few new clues on tariffs.
The data slate is light aside from Friday’s inflation figures, and there are few earnings releases. Further out, the Q1 earnings season, which begins with JPMorgan (JPM) on the morning of April 11, could be the clearing event markets need to rally.
By then, we’ll have February PCE and the March jobs report in hand, not to mention refined details on trade policy. Markets typically respond negatively to uncertainty; historically, clearer economic data and corporate guidance have often been associated with improved market sentiment.
GDP growth could potentially remain subdued until there's clearer evidence regarding how current policies might impact the macroeconomy. Investors must remember that stocks generally move about six months ahead of economic changes.
Weekly Calendar Look Ahead
While there aren’t many impactful reports this week, Monday morning’s S&P Global PMIs (flash for March) could move the stock and bond markets. We’ll get both the Manufacturing and Services gauges right after the opening bell. Economists expect numbers above 50—indicating expansion—which would bring the Composite PMI to 51, almost unchanged from February. This is an important “vibes” report as it surveys over 800 companies around the country. Not as widely telegraphed as the ISM’s PMIs, S&P Global’s version still often contains nuggets on the macro, particularly on sales, new orders, employment, inventories, and prices. February's Composite score was the weakest since April 2024, with the service sector having slowed to a 15-month low—once again, it’s the “wait and see” economy. T-bill auctions hit later in the morning, and the Fed’s Bostic and Barr speak in the afternoon.
More Fed speak comes Tuesday via Kugler and Williams in the morning. Johnson Redbook retail sales arrives in the premarket before a January read on US home prices from the S&P/Case-Shiller Home Price Index; forecasters expect a 4.6% annual jump in real estate values. Later, The Conference Board’s March Consumer Confidence report crosses the wires at 10 a.m. ET—this survey is more closely linked to labor market conditions than the University of Michigan’s report. The Richmond Fed Index—a regional business activity survey—is released at the same time as February New Home Sales.
The mid-week headliner is Durable Goods for February. A sequential decline of 0.7% is expected. Kashkari and Musalem—a pair of hawks—speak Wednesday morning.
Thursday’s slate is packed with macro updates, but they shouldn’t be too impactful. A final revision to Q4 GDP and its related components (PCE prices, sales, consumer spending, corporate profits) comes in the premarket along with the usual jobless claims data. Last week, Initial Claims was once again low, with no meaningful change in the trend of Continuing Claims. Also at 8:30 a.m. ET, the Goods Trade Balance figures for last month are released—the deficit widened to a record $153.3 billion in January, and economists expect a tighter (but still massive) $134.6 billion negative goods imbalance as firms stock up before tariffs. Heavy imports from January through March will surely weigh on Q1 GDP. Later, Pending Home Sales for February are released—with mortgage rates now firmly below 7%, we could see a pickup as the spring selling season gets closer. The KC Fed Manufacturing and Composite Indexes prints at 11 a.m. before Treasury auctions and a speech by Barkin at the Fed.
With several “B and “C” level economic reports Monday through Thursday, the focus shifts to the most impactful update—Friday’s Personal Income and Spending update and PCE Price Index refreshes for February. The consensus calls for a 0.6% sequential spending increase, with incomes rising by 0.4%, bringing the Personal Saving Rate down slightly from January’s seven-month high. The headline PCE Price Index is seen as having risen by 0.3% month-over-month, with the core rate climbing by the same. That would bring the Fed’s preferred inflation gauge to 2.5% YoY (2.6% core). The week’s chorus of Fed speak continues into the afternoon, but not before a final look at the politically-charged UMich consumer sentiment survey—a gauge that Powell dubbed “an outlier” during last week’s presser and a report Allio has widely dismissed as a relevant macro indicator in recent months.
Fiscal Policy Framework
Congress returns for a three-week session before its spring recess, and GOP lawmakers will focus on their budget reconciliation package. House Republicans target an April 7 resolution to keep the government funded through September. The draft may include details on the debt limit as well. Senate Democratic Leader Chuck Schumer came under fire from his colleagues and others on the left for caving to the GOP earlier this month as the March government shutdown loomed. Depending on how legislation progresses, we could see more Democratic infighting as the party struggles to find a new identity. Recent polls show the Democratic Party’s favorability at record lows.
Senate Republicans will meet to flesh out long-term budget forecasts, including penciling in fiscal impacts to extending the 2017 Tax Cuts and Jobs Act, which may cost between $4-$5 trillion. In the here and now, the April 2 tariff date is front and center. President Trump said on Friday that there may be flexibility with certain countries, and stocks inched into the green on that news. Among G20 countries, the US actually has the least amount of total trade barriers, per BofA Global Research, so there is increasing chatter that Trump’s tariffs will ultimately work to boost free trade—that would be a tremendously bullish development if it were to occur.
Risks and Opportunities
Last week, we noted that the case for an oversold bounce had increased, and after Tuesday’s decline, markets finally rebounded. The S&P 500 has now rallied intraday in five of the past six sessions, suggesting that the bulls are trying their best to grab a foothold of the near-term trend. Unfortunately, consumer stocks and small caps keep lagging—we had hoped for a more impressive bounce, particularly after a dovish Fed Day last week. The dollar experienced a rally last week, aligning with scenarios we previously discussed as possibilities—the DXY turned oversold before rising by 0.8% over the back half of the week.
Given the upcoming macroeconomic data and hedge fund positioning ahead of quarter-end, volatility may potentially increase this Thursday and Friday. Barring tariff developments, investors will be on edge ahead of April 2. It’s important to call out that the VIX closed below 20 last week—it's a reminder that markets can only be shocked so many times by the same sort of headlines.
Our team is concerned, though, about price action in large tech stocks. Collectively, there has not been a strong bounce off their March lows. Typically, we’d like to see a washout, or capitulation-like, move before turning bullish on a particular space. We’ll see if we get that among the Mag 7 before the aforementioned potential market-clearing events.
Quick Hits
Copper prices rose to an all-time high last week, which may suggest positive economic signals
BofA’s March Global Fund Manager Survey showed the biggest drop in US equity allocations on record (though EPFR data revealed inflow to domestic stocks last week)
CoreWeave (CRWV) is expected to IPO Wednesday night and begin trading Thursday, the highest-profile IPO of the year
Gold touched another all-time high ($3057) last week. It’s up 11 of the past 12 weeks.
9 of 11 S&P 500 sector are up on the year, suggesting decent market breadth
As Chair Powell noted, long-term inflation expectations are subdued at 2.15%, per the 5-10-year breakeven inflation rate


Related Articles
AJ Giannone, CFA
Week of April 14, 2025
Retail sales in focus as volatility shakes markets. Tariff shifts, inflation data, and soaring tech stocks set the stage for another wild macro week

AJ Giannone, CFA
Week of April 7, 2025
CPI, PPI, FOMC minutes, tariff impact, and earnings in focus amid historic market selloff, soaring VIX, and rising recession odds—volatility intensifies.

Joseph Gradante, Allio CEO
Week of March 31, 2025
A high-stakes week in markets: jobs data, tariffs, and Powell’s speech take center stage. Key macro signals could shape Q2 momentum and recession odds.
AJ Giannone, CFA
Week of April 14, 2025
Retail sales in focus as volatility shakes markets. Tariff shifts, inflation data, and soaring tech stocks set the stage for another wild macro week
AJ Giannone, CFA
Week of April 7, 2025
CPI, PPI, FOMC minutes, tariff impact, and earnings in focus amid historic market selloff, soaring VIX, and rising recession odds—volatility intensifies.
Disclosures
This material is for informational purposes only and should not be construed as financial, legal, or tax advice. You should consult your own financial, legal, and tax advisors before engaging in any transaction. Information, including hypothetical projections of finances, may not take into account taxes, commissions, or other factors which may significantly affect potential outcomes. This material should not be considered an offer or recommendation to buy or sell a security. While information and sources are believed to be accurate, Allio Capital does not guarantee the accuracy or completeness of any information or source provided herein and is under no obligation to update this information.
Past performance is not a guarantee or a reliable indicator of future results. All investments contain risk and may lose value. Performance could be volatile; an investment in a fund or an account may lose money.
There is no guarantee that these investment strategies will work under all market conditions or are appropriate for all investors and each investor should evaluate their ability to invest long-term, especially during periods of downturn in the market.
This advertisement is provided by Allio Capital for informational purposes only and should not be considered investment advice, a recommendation, or a solicitation to buy or sell any securities. Investment decisions should be based on your specific financial situation and objectives, considering the risks and uncertainties associated with investing.
The views and forecasts expressed are those of Allio Capital and are subject to change without notice. Past performance is not indicative of future results, and investing involves risk, including the possible loss of principal. Market volatility, economic conditions, and changes in government policy may impact the accuracy of these forecasts and the performance of any investment.
Allio Capital utilizes proprietary technologies and methodologies, but no investment strategy can guarantee returns or eliminate risk. Investors should carefully consider their investment goals, risk tolerance, and financial circumstances before investing.
For more detailed information about our strategies and associated risks, please refer to the full disclosures available on our website or contact an Allio Capital advisor.
For informational purposes only; not personalized investment advice. All investments involve risk of loss. Past performance of any index or strategy is not indicative of future results. Any projections or forward-looking statements are hypothetical and not guaranteed. Allio is an SEC-registered investment adviser – see our Form ADV for details. No content should be construed as a recommendation to buy or sell any security.
What We Do
What We Say
Who We Are
Legal
Allio Advisors LLC ("Allio") is an SEC registered investment advisor. By using this website, you accept our Terms of Use and our Privacy Policy. Allio's investment advisory services are available only to residents of the United States. Nothing on this website should be considered an offer, recommendation, solicitation of an offer, or advice to buy or sell any security. The information provided herein is for informational and general educational purposes only and is not investment or financial advice. Additionally, Allio does not provide tax advice and investors are encouraged to consult with their tax advisor. By law, we must provide investment advice that is in the best interest of our client. Please refer to Allio's ADV Part 2A Brochure for important additional information. Please see our Customer Relationship Summary.
Online trading has inherent risk due to system response, execution price, speed, liquidity, market data and access times that may vary due to market conditions, system performance, market volatility, size and type of order and other factors. An investor should understand these and additional risks before trading. Any historical returns, expected returns, or probability projections are hypothetical in nature and may not reflect actual future performance. Past performance is no guarantee of future results.
Brokerage services will be provided to Allio clients through Allio Markets LLC, ("Allio Markets") SEC-registered broker-dealer and member FINRA/SIPC . Securities in your account protected up to $500,000. For details, please see www.sipc.org. Allio Advisors LLC and Allio Markets LLC are separate but affiliated companies.
Securities products are: Not FDIC insured · Not bank guaranteed · May lose value
Any investment , trade-related or brokerage questions shall be communicated to support@alliocapital.com
Please read Important Legal Disclosures
v1 01.20.2025